
Hey there, fellow architects! Today, let’s dive into the world of C4 diagramming. If you’re like me, you need a good visual aid to make sense of complex systems. C4 diagrams are perfect for understanding and documenting software architecture. Let’s break down what C4 stands for and explore the different types of diagrams it offers.
- What on Earth is a C4 Diagram?
- The Four Levels of C4
- What Tools Should I Use to Create C4 Diagrams?
- Wrapping It Up: Why Use C4 Diagrams?
- Where to Go From Here
What on Earth is a C4 Diagram?
C4 stands for “Context, Containers, Components, and Code” – catchy, right? It’s a framework created by Simon Brown that helps software developers visualize and document the architecture of their software systems. Think of it as a GPS for navigating through your system’s architecture.
The Four Levels of C4
Each level of diagram is effectively a drill-down into successively more detail. I like to use the phrase, “Double click into the next level of detail.”
Context Diagrams: The Bird’s-Eye View
Imagine you’re flying above a city in a helicopter. That’s what a Context Diagram gives you – a high-level overview of your system. It shows how your system interacts with its users and other systems.

Figure 1 – System Context Diagram (credit c4model.com). Click to zoom in.
Example Application: Let’s say you’re working on a banking system. A Context Diagram shows the app’s interaction with users and other systems – internal to your company or external.
These are useful for onboarding new team members or giving stakeholders a quick glimpse without overwhelming them with details.
Container Diagrams: Peeking Inside the Black Box
Now, let’s lower our helicopter and peek into the buildings. Container Diagrams break down the system into containers (like web applications, mobile apps, databases, etc.). It’s a zoomed-in version of the Context Diagram where each container represents an application or a data store.
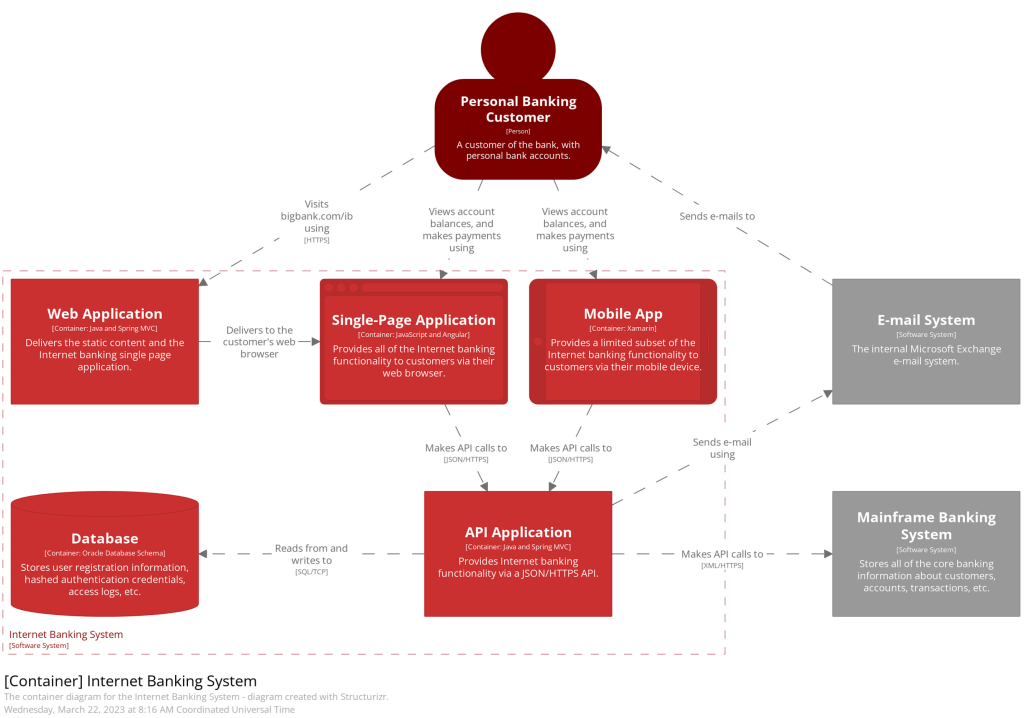
Figure 2 – Container Diagram (credit c4model.com). Click to zoom in.
Example Application: In our banking system, a Container Diagram might include the user-facing mobile app, the web application that allows the user to manage their account, the API that the web application uses as the backend, or the database storing system data.
This type of diagram is useful for more technical folks. This can include your development team or technical product owners.
Component Diagrams: The Nuts and Bolts
Time to enter the buildings and check out the different floors. Component Diagrams dive deeper into each container to show how various components (modules, classes, services) interact within them. This is where it gets more technical and is mainly for the development team’s benefit.
This is a double-click into a container.
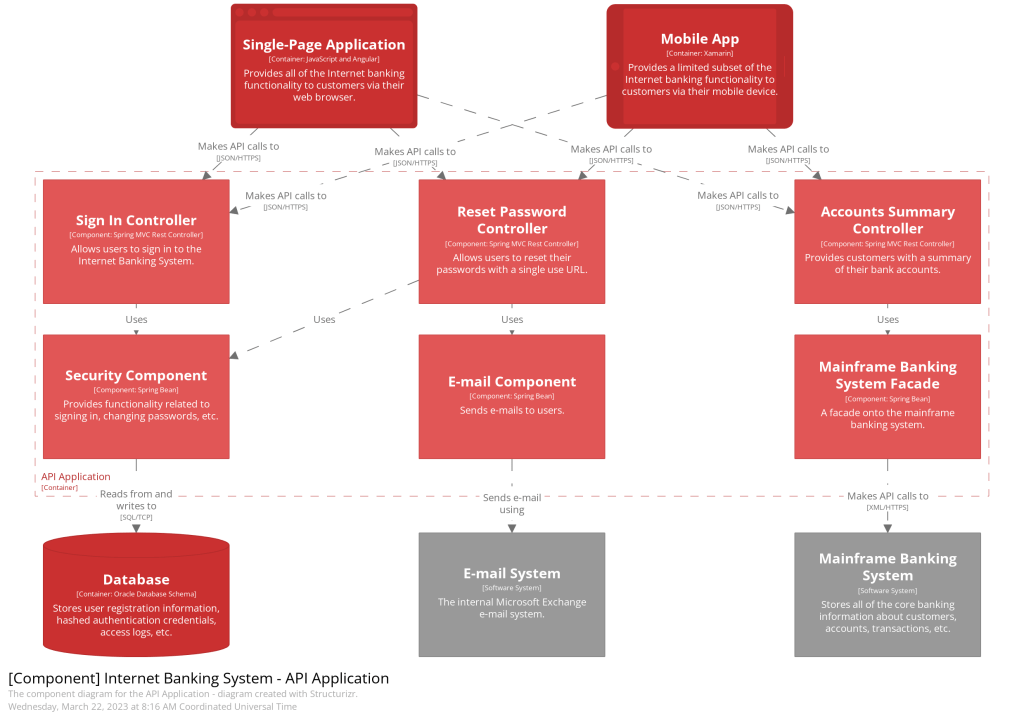
Figure 3 – Component Diagram (credit c4model.com). Click to zoom in.
Example Application: Inside the API container of our banking system app, a Component Diagram would show components like the controllers, repositories that interact with the database, email components that interact with the email system, or the facade that abstracts the legacy mainframe system.
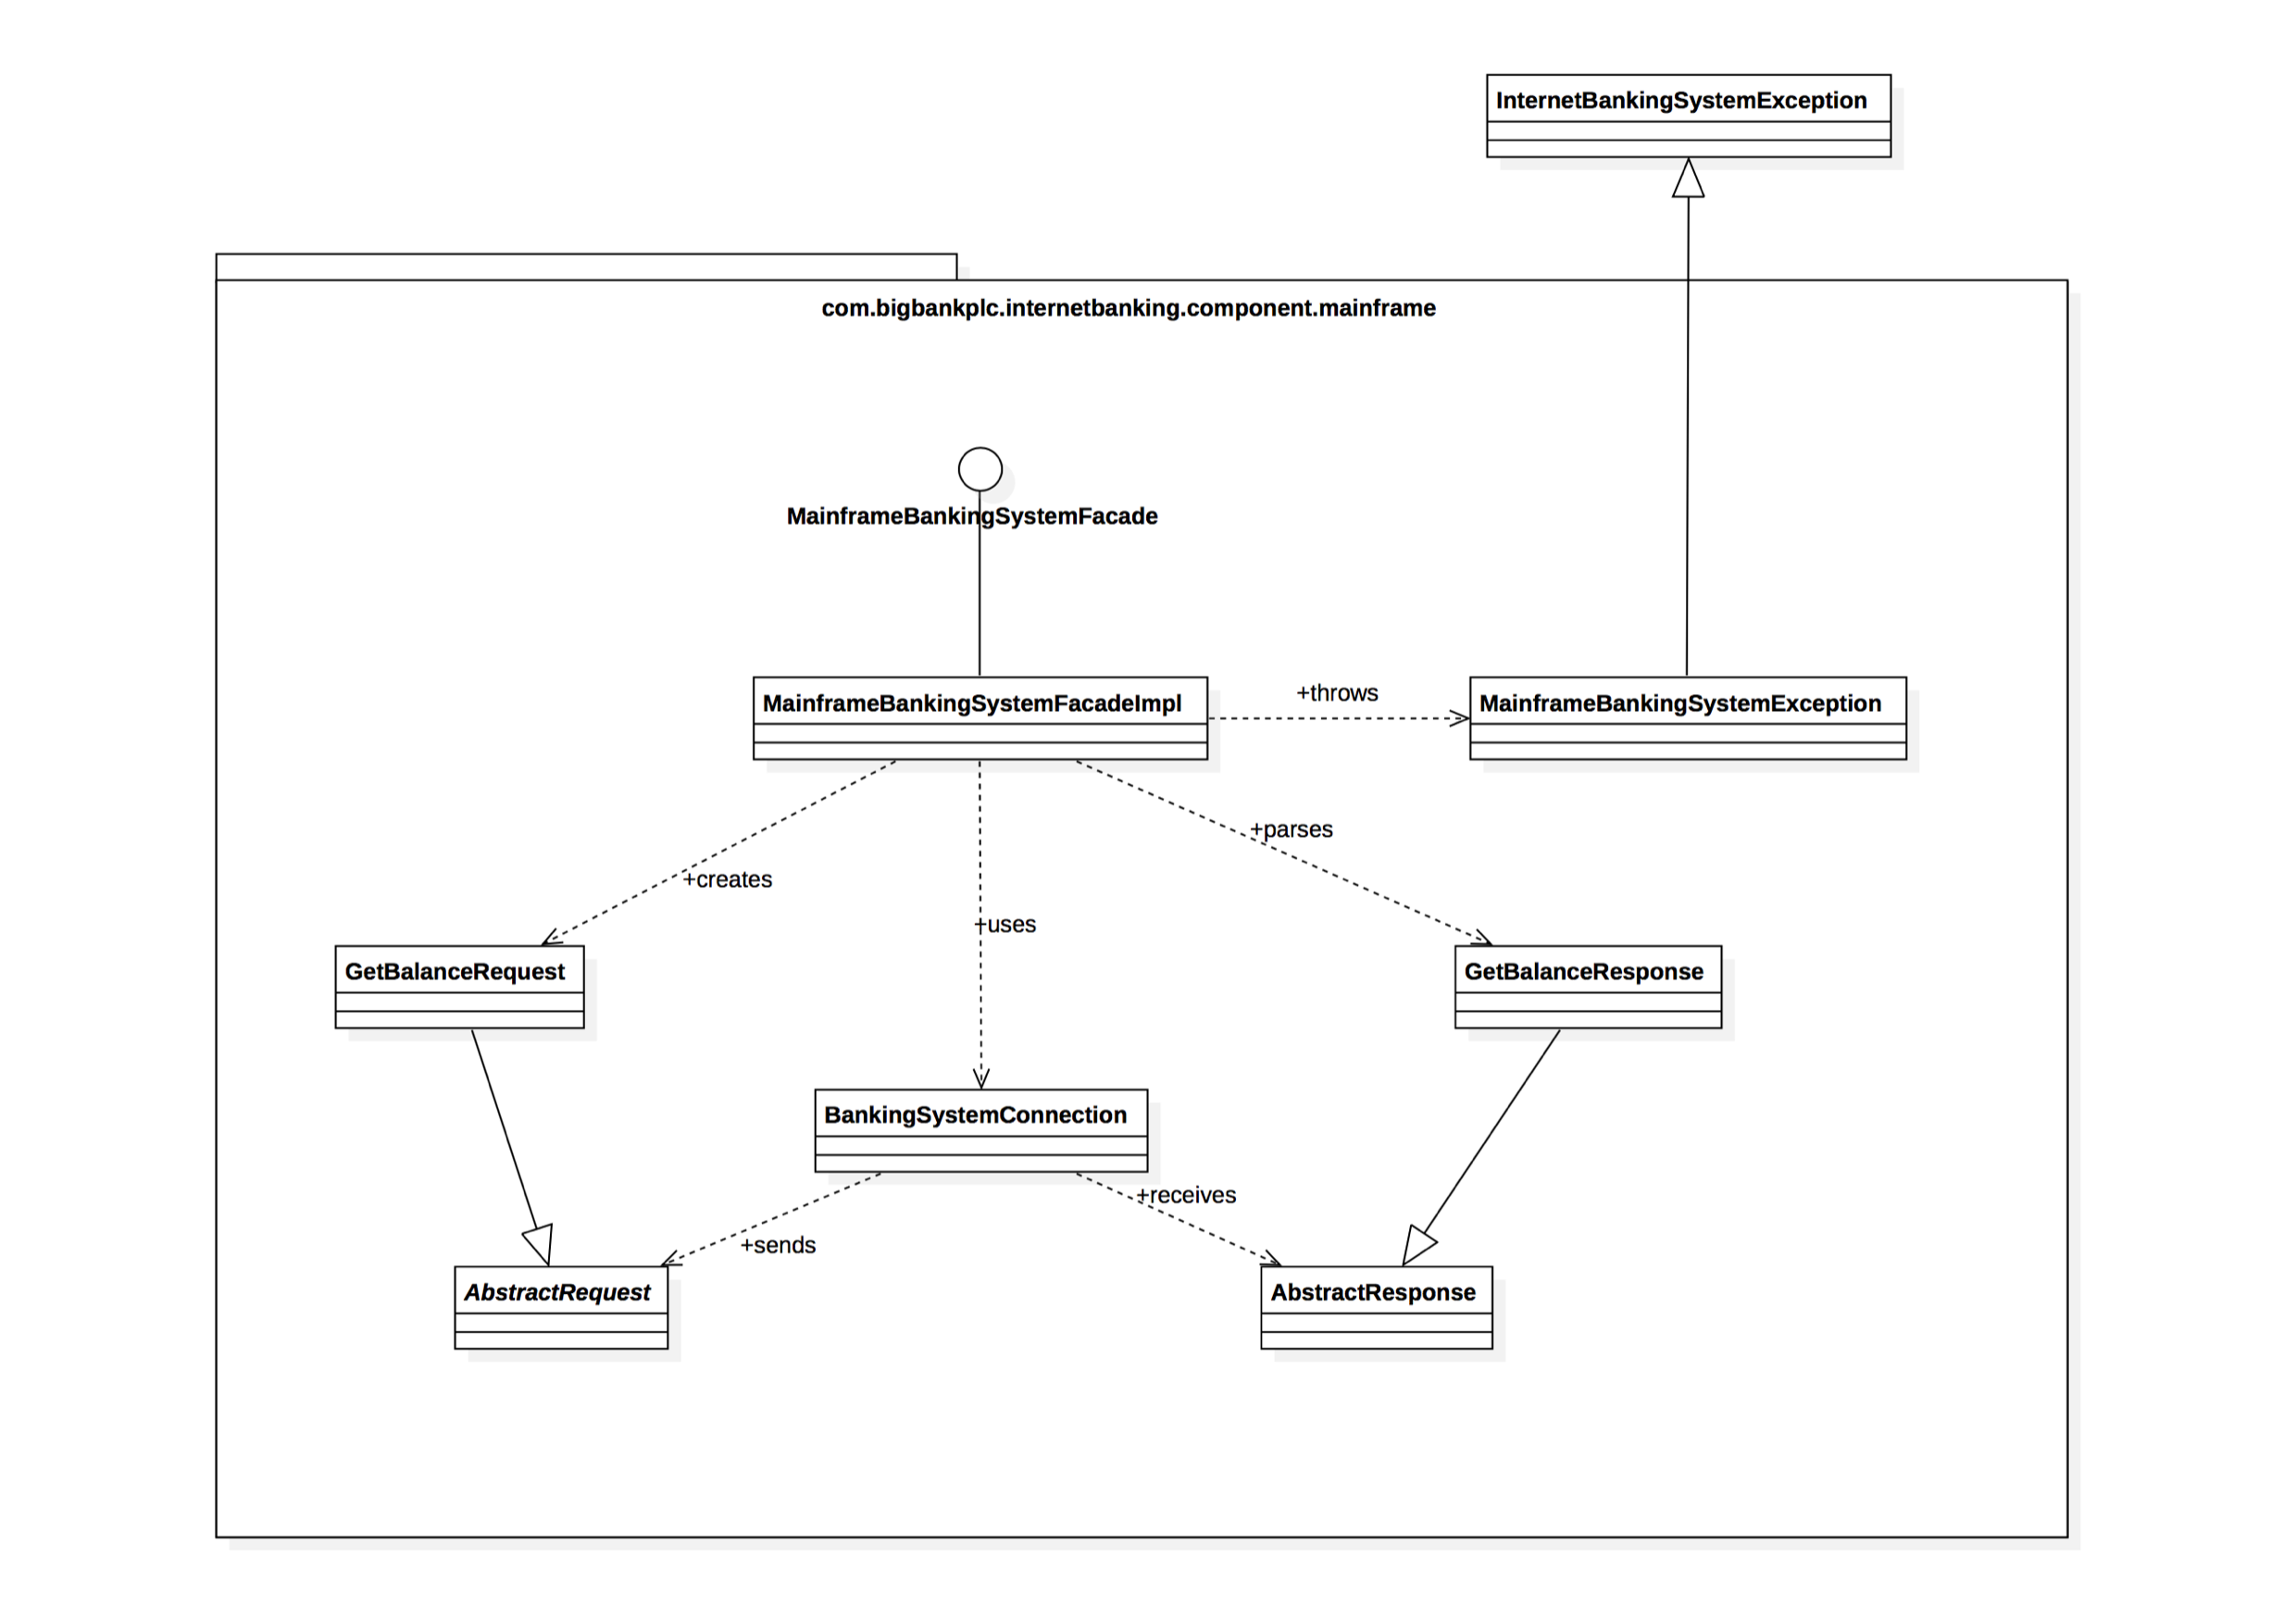
Code Diagrams: The Finest Details
Finally, it’s like looking under the hood of a car. Code Diagrams are the most detailed, showing how specific parts of the code are structured. Honestly, they’re often too detailed for most needs, but they’re super useful for complex logic and algorithms.

Figure 4 – Code Diagram (credit c4model.com). Click to zoom in.
Example Application: For a particular component like the Mainframe Facade, a Code Diagram would detail classes and interfaces that handle payments, request/response implementations, exceptions, or other implementation details
These diagrams target software engineers or SDETs.
What Tools Should I Use to Create C4 Diagrams?
Creating C4 diagrams requires tools that can effectively handle different layers of abstraction, from high-level overviews to detailed code-level diagrams. Here’s a list of tools commonly used for this purpose:
- Structurizr (https://structurizr.com): This is a web-based tool specifically designed for creating C4 diagrams. It allows you to define your model in code and then generates the diagrams for you, ensuring they are always up to date with your codebase.
- PlantUML (https://www.plantuml.com): A popular open-source tool that uses a simple and intuitive language to create diagrams. It can be integrated with various documentation systems and supports C4 model diagramming.
- Lucidchart (https://www.lucidchart.com/pages/): A web-based visual workspace that offers diagramming capabilities. It’s versatile and user-friendly, suitable for creating various types of diagrams, including C4.
- Draw.io (now diagrams.net) (https://www.drawio.com): A free, online diagramming tool that’s widely used for various types of diagrams. It’s flexible and integrates well with other tools like Confluence and Google Drive.
- Microsoft Visio (https://www.microsoft.com/en-us/microsoft-365/visio/flowchart-software): A part of the Microsoft Office family, Visio is a powerful diagramming tool that can be used for creating C4 diagrams, although it might require more manual effort compared to others.
- Mermaid (https://mermaid.js.org): Like PlantUML, Mermaid is a text-to-diagram tool that lets you create diagrams using a markdown-like syntax. It’s great for embedding diagrams in documentation.
- C4-Builder (https://adrianvlupu.github.io/C4-Builder/#/): A tool that generates C4 diagrams from code. It’s useful for keeping diagrams in sync with the codebase.
- ArchiMate (https://www.archimatetool.com): A technical standard from The Open Group, ArchiMate is often used in enterprise architecture but can be adapted for C4 diagramming.
- Miro (https://miro.com): A collaborative online whiteboarding platform that can be used to create C4 diagrams, especially in a collaborative setting or workshop.
- SmartDraw (https://miro.com): This is another alternative that offers robust diagramming capabilities, including support for C4 diagrams.
When choosing a tool, consider factors like ease of use, integration capabilities with your existing toolchain, collaboration features, and the level of detail you need for your diagrams. Each tool has its strengths, so the best choice depends on your specific needs and preferences.
Wrapping It Up: Why Use C4 Diagrams?
C4 Diagrams are like a multi-layered map for your software architecture. They help teams communicate effectively, onboard new members quickly, and keep everyone on the same page. As an architect, C4 Diagramming is a skill worth mastering in the ever-evolving world of software development.
So next time you’re lost in a sea of code, remember the C4 Diagrams. They’re your friendly guide in the complex journey of software architecture. Happy diagramming! 🚀👨💻👩💻
Where to Go From Here
Check out https://c4model.com for full details.


Leave a comment